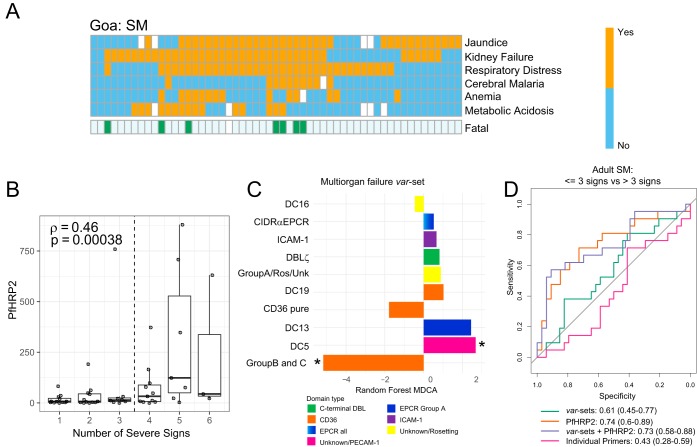
FIG 4.
Plasma PfHRP2 levels are associated with the number of severe malaria criteria in adults. (A) Heat map showing prevalence of clinical signs of adult SM in Goa. Fatal SM cases are indicated below. A white box indicates missing information. (B) Box and dot plot of plasma PfHRP2 levels in adult SM, stratified by number of severity criteria. The median is indicated by a horizontal line. (C) Bar plot showing importance of primer sets in the severe criterion count var set model. Negative MDCAs indicate sets with lower expression in patients with >3 severity criteria. (D) ROC curves showing the predictive power of individual var domain subtypes, PfHRP2 levels, var domain subtypes grouped by binding phenotype (var sets), and var sets combined with PfHRP2 levels to classify adult SM patients as having up to three clinical signs versus those with over three clinical severe signs.

