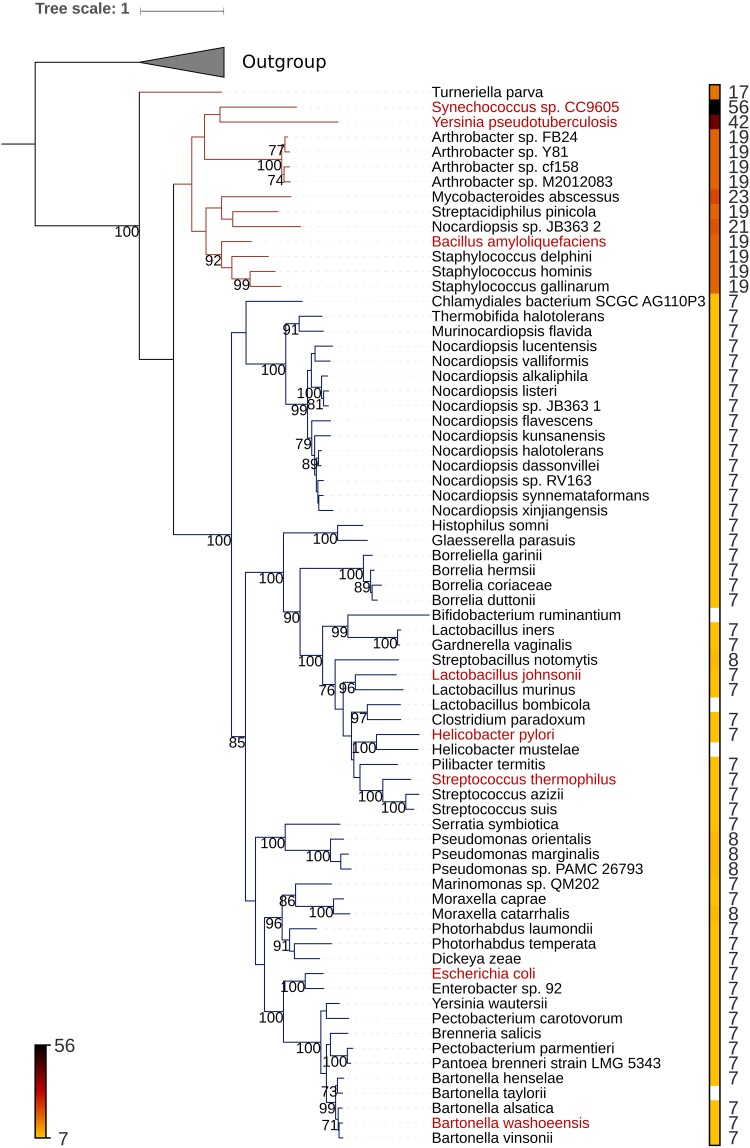
FIG 2.
Maximum likelihood phylogenetic tree of MccB and MccB-like proteins. The unrooted tree was generated using RAxML (24) with 400 bootstrap replicates. The numbers at the nodes indicate the bootstrap values. Only bootstrap values greater than 70% are shown. Scale bar shows the number of inferred amino acid substitutions per site. Triangle marks the outgroup consisting of PaaA homologs not involved in the production of McC-like compounds. Each terminal node of the tree corresponds to the sequence representing a cluster of identical proteins and is labeled by the full systematic name of an organism (for the full data set see Table S1 in the supplemental material). The names of the organisms bearing the validated mcc clusters are shown in red. For other organisms, precursor peptides are putative and obtained by manual sequence analysis of mcc-like clusters. The lengths (in amino acids) of the verified or predicted microcin C precursor peptides are indicated both by labels and by the color strip. The color palette is given on the bottom left. White indicates that we were unable to predict the peptide. The blue and the red branches correspond to MccB subfamilies associated with 7-amino-acid and longer MccA precursors, respectively.

