
Figure 4.
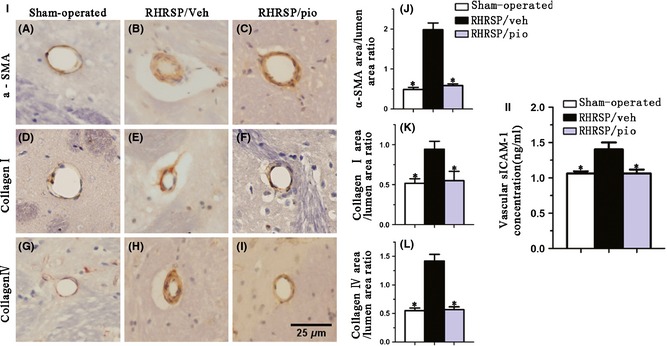
I, Immunohistochemical staining for α‐SMA (A, B, C), collagen I (D, E, F), and collagen IV (G, H, I) in small vessels. Bar graphs indicate ratios of immunoreactive area to luminal area for α‐SMA (J), collagen I (K), and collagen IV (L). II, Assessment of expression of vascular sICAM‐1 through ELISA. Data are presented as mean ± SEM. *P < 0.05 versus the RHRSP/veh. α‐SMA, smooth muscle actin‐alpha; sICAM‐1, soluble intercellular adhesion molecule‐1; RHRSP/veh, RHRSP treated with vehicle; RHRSP/pio, RHRSP treated with pioglitazone.