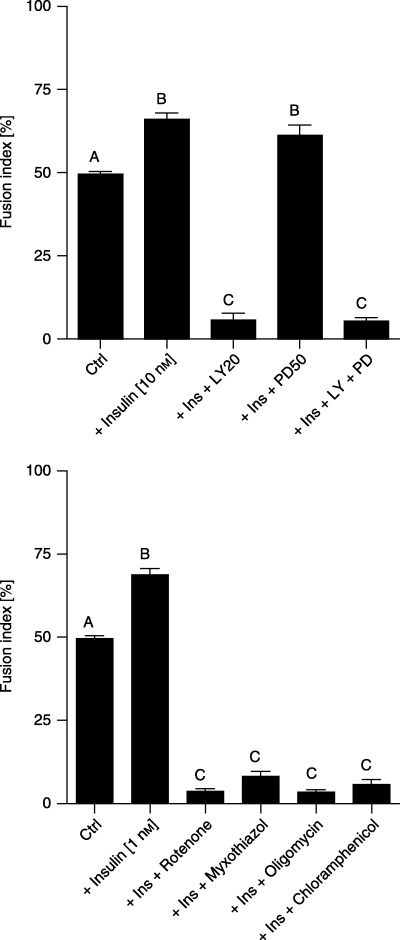
Figure 3.

Bar charts representing fusion indices calculated at the third day of the experiment on the basis of nuclei scored in C2C12 muscle cells and myotubes. Top: effect of insulin (10 nm), PD98059 (50 µm) being present 30 min prior to insulin (10 nm) addition, LY294002 (20 µm) being present 30 min prior to insulin (10 nm) addition, or PD98059 (50 µm) and LY294002 (20 µm) both being present 30 min prior to insulin (10 nm) addition. Bottom: effect of insulin (1 nm), rotenone (10 µm) being present 30 min prior to insulin (1 nm) addition, myxothiazol (1 µm) being present 30 min prior to insulin (1 nm) addition, oligomycin (1 ng/ml) being present 30 min prior to insulin (1 nm) addition or chloramphenicol (0.1 mg/ml) being present 30 min prior to insulin (1 nm) addition. Bars that differ statistically significantly at least at level of 0.01 are ticked by different capital letter. Each experiment was performed in eight replicates and repeated at least twice with similar results.
