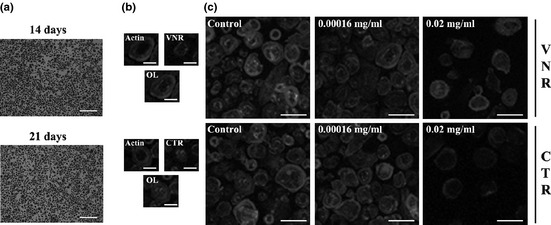
Figure 3.

Staining of PBMC cultures treated with the extract. PBMC cultures (M+R) stained for nuclei and TRAP at days 14 and 21 of culture (a). CLSM visualization of PBMC cultures (21 days) supplemented with M‐CSF and RANKL: b – Representative images; c – PBMC cultures: control and exposed to the extract. White bars represent 600 μm (a), 40 μm (b) and 100 μm (c).
