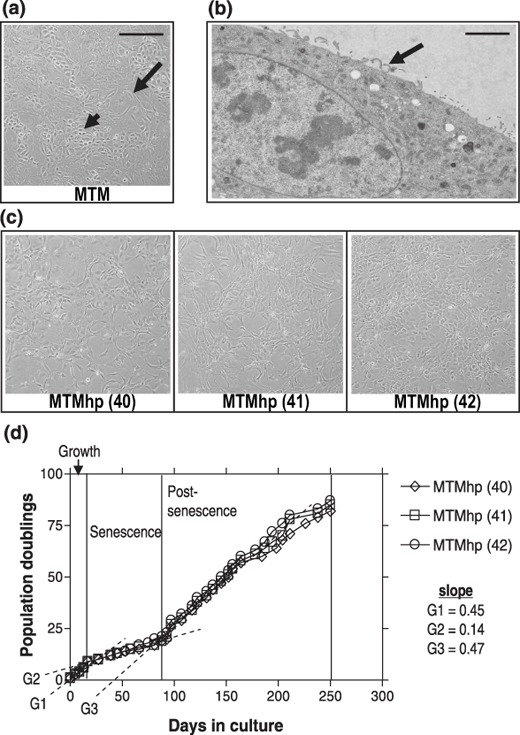
Figure 1.

(a) Primary mesothelial cultures (MTM) contained cells with mixed epithelial (small arrow) and fibroblastic‐like morphologies (large arrow). (b) Representative transmission electron micrograph (TEM) of a spontaneously transformed mesothelial cell with characteristic surface microvilli (arrow). Scale bar = 2.5 µm. (c) Spontaneously transformed mesothelial cell lines MTMhp (40) and MTMhp (41) display fibroblastic morphology and MTMhp (42) cells have epithelioid morphology. (a) and (c) scale bar = 100 µm. (d) Population doubling profiles of cell lines. G1, G2 and G3 represent a gradient calculated by linear regression.
