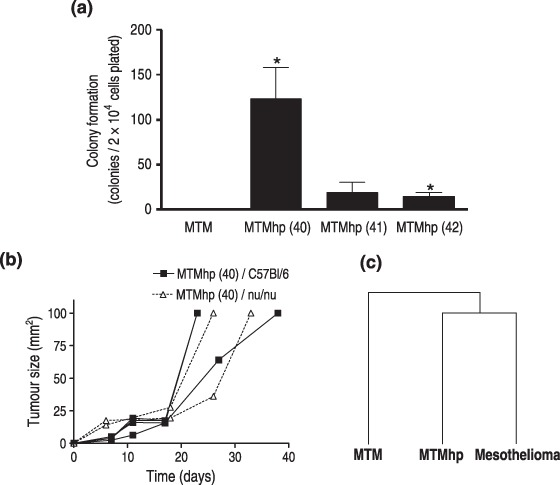
Figure 4.

(a) Primary and spontaneously transformed mesothelial cells were cultured from limiting dilution in semisolid medium for 28 days. Colonies were stained with crystal violet and counted manually (>5 cells per colony) using a light microscope. Results were calculated from triplicate wells of two independent experiments and are displayed as the mean number of colonies per 2 × 10⁴ plated cells ± SEM. *P < 0.05. (b) Single cell suspensions (5 × 10⁶ cells) of spontaneously transformed cell lines were injected subcutaneously into syngeneic (C57Bl/6; n = 4) and athymic (nu/nu; n = 2) mice. Tumour growth after injection of the MTMhp (40) cell line is shown, as it was the only cell line that generated tumours. Mice were monitored weekly for tumour formation for up to 100 days. (c) Hierarchical clustering using mean gene expression data from triplicate MTM, MTMhp and mesothelioma cell lines when compared to normal mesothelial cells.
