
Figure 8.
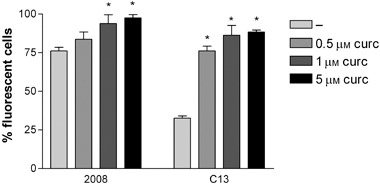
Effect of curcumin on ROS generation in 2008 and C13 cells. The cells were exposed for 2 hours to (0.5, 1.0 and 5.0 µm) curcumin and ROS detected by H2DCF staining and flow cytometry. Results are expressed as percentage of fluorescent cells. Each bar represents the mean ± SD from four replicates, and three independent experiments were carried out. *p < 0.01 compared to control.