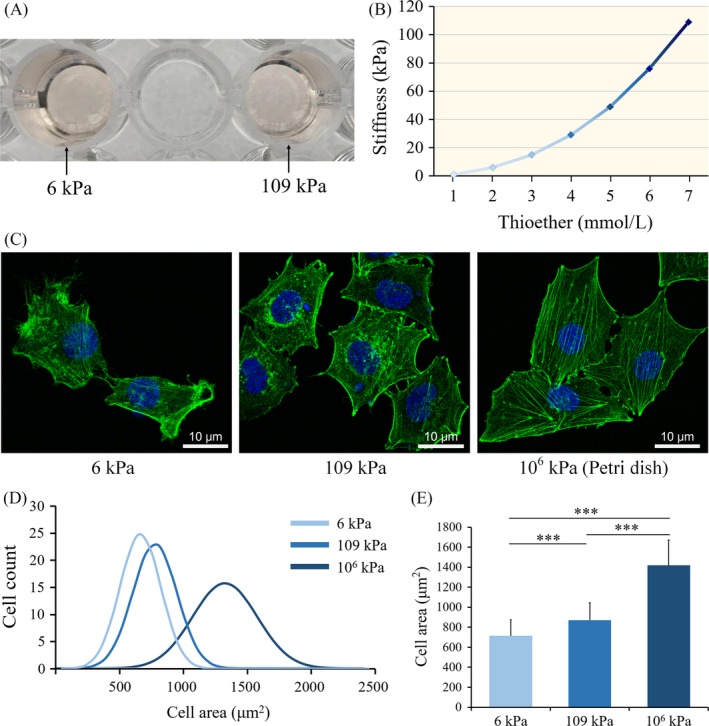
Figure 2.

A, Two dextran hydrogels with different stiffnesses after crosslinking; B, Stiffnesses of dextran hydrogels with different dextran (thioether bond) contents; five different samples were tested as indicated; C, Fluorescent images of the cytoskeleton (phalloidin staining of F‐actin) of EPCs on matrix of the indicated stiffness. Scale bars are 20 μm; D, Distributions of cell area of EPCs on matrices of varying degrees of stiffness; E, Quantitative assessment of cell morphology; 100 cells were measured in each group. *P < 0.05, **P < 0.01, ***P < 0.001. Data shown are representative of three independent experiments
