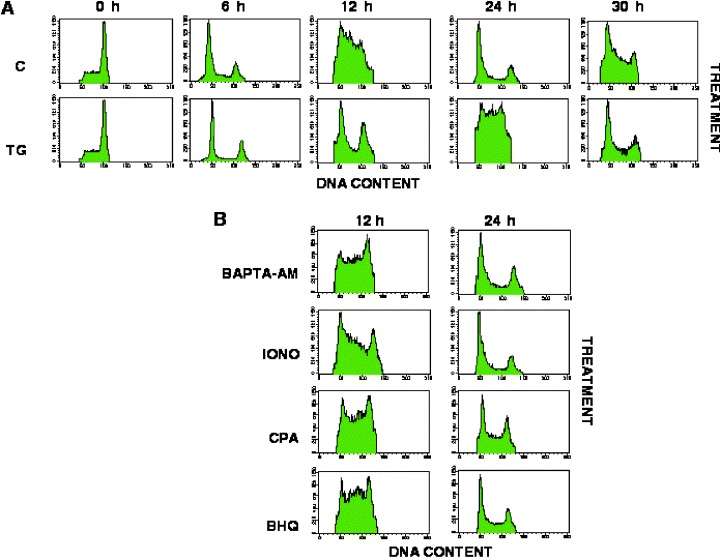
Figure 3.

Thapsigargin Delays G1/S‐Phase Progression. (a) Synchronized cells were treated with reagents as described in Figure 2a; Control, TG/EGTA. At the times indicated, aliquots of the culture were fixed using 80% ethanol and stained using propidium iodide as described in ‘Materials and Methods’. DNA content was analysed using standard flow cytometric techniques. (b) Cells were treated with BAPTA‐AM (10 µm), ionomycin (IONO; 1 µm), CPA (10 µm) and BHQ (30 µm) as described in ‘Materials and Methods.’ Flow cytometry profiles of treated cells, fixed at 12 h and 24 h, are shown.
