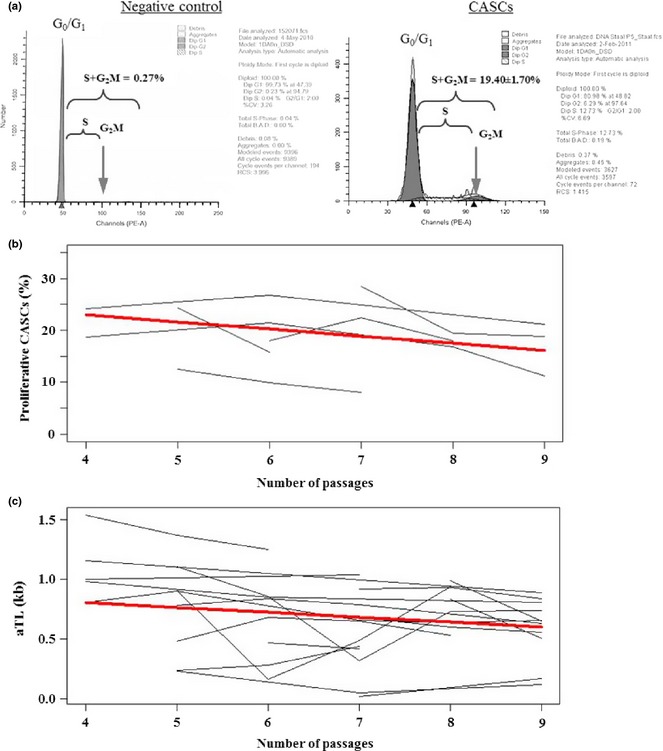
Figure 2.

Proliferation and absolute telomere length (aTL) of expanded cardiac atrial appendage stem cells ( CASC s). Representative cytometry output of cell cycle distribution of peripheral blood cells (negative control, a left) and expanded CASCs (P4–P9) (a right). (b) Individual (grey lines) and average (bold red line) linear reduction in percentage of proliferating CASCs with increasing passages (P = 0.046). (c) Individual (grey lines) and average (bold red line) inverse linear relation between aTL and passage number (P = 0.019).
