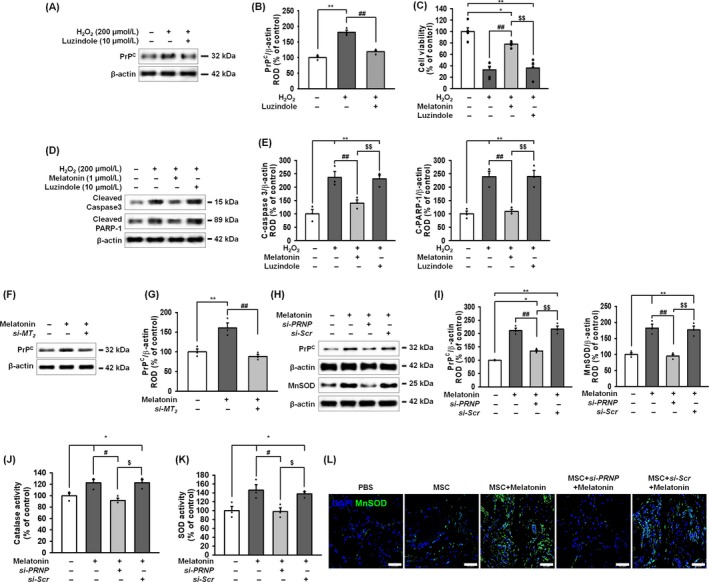
Figure 3.

The anti‐oxidative effect of melatonin on MnSOD and catalase reduced cell viability through the melatonin‐MT2‐PrPC axis under oxidative stress. A, Expression of PrPC after treatment of MSCs with melatonin and a combination of melatonin and luzindole (10 μmol/L; an MT1 and MT2 antagonist). B, PrPC was quantified by densitometry and normalized to that of β‐actin. Values represent the mean ± SEM. **P < 0.01 vs untreated MSCs and ## P < 0.01 vs MSCs treated with melatonin. C, Viability of melatonin‐treated MSCs after treatment with H2O2 with/without luzindole. Values represent the mean ± SEM. *P < 0.05; **P < 0.01 vs untreated MSCs and ## P < 0.01 vs MSCs +H2O2. $$ P < 0.01 vs MSCs + melatonin + H2O2. D, Expression of cleaved caspase‐3 and cleaved PARP‐1 after treatment of melatonin‐pretreated MSCs with H2O2 (200 μmol/L). E, The levels of these proteins were normalized to that of β‐actin. Values represent the mean ± SEM. **P < 0.01 vs untreated MSCs, ## P < 0.01 vs MSCs + H2O2, and $$ P < 0.01 vs MSCs + melatonin + H2O2. F, Western blot of PrPC after treatment of MSCs with melatonin and a combination of melatonin and MT2 siRNA (si‐MT2). G, The level of PrPC was quantified by densitometry and normalized relative to the β‐actin expression level. Values represent the mean ± SEM. **P < 0.01 vs untreated MSCs and ## P < 0.01 vs MSCs treated with melatonin. H, Western blot of PrPC and MnSOD after treatment of MSCs with melatonin, a combination of melatonin and PRNP siRNA (si‐PRNP), or a combination of melatonin and scrambled siRNA (si‐Scr). I, The expression of PrPC and MnSOD were quantified by densitometry and normalized relative to the β‐actin expression level. Values represent the mean ± SEM. **P < 0.01 vs untreated MSCs, ## P < 0.01 vs MSCs treated with melatonin, and $$ P < 0.01 vs MSCs treated with melatonin and si‐PRNP. J, Catalase activity after treatment of MSCs with melatonin, a combination of melatonin and si‐PRNP, or a combination of melatonin and si‐Scr. Values represent the mean ± SEM. *P < 0.05 vs untreated MSCs, # P < 0.05 vs MSCs treated with melatonin, and $ P < 0.05 vs MSCs treated with melatonin and si‐PRNP. K, SOD activity after treatment of MSCs with melatonin, a combination of melatonin and si‐PRNP, or a combination of melatonin and si‐Scr. Values represent the mean ± SEM. *P < 0.05 vs untreated MSCs, # P < 0.05 vs MSCs treated with melatonin, and $ P < 0.05 vs MSCs treated with melatonin and si‐PRNP. L, Immunofluorescent staining for DAPI (blue) and MnSOD (green) in ischaemic‐injured tissues injected with PBS, MSCs, melatonin‐treated MSCs, melatonin‐treated MSCs plus si‐PRNP or melatonin‐treated MSCs plus si‐Scr. Scale bar = 50 μm
