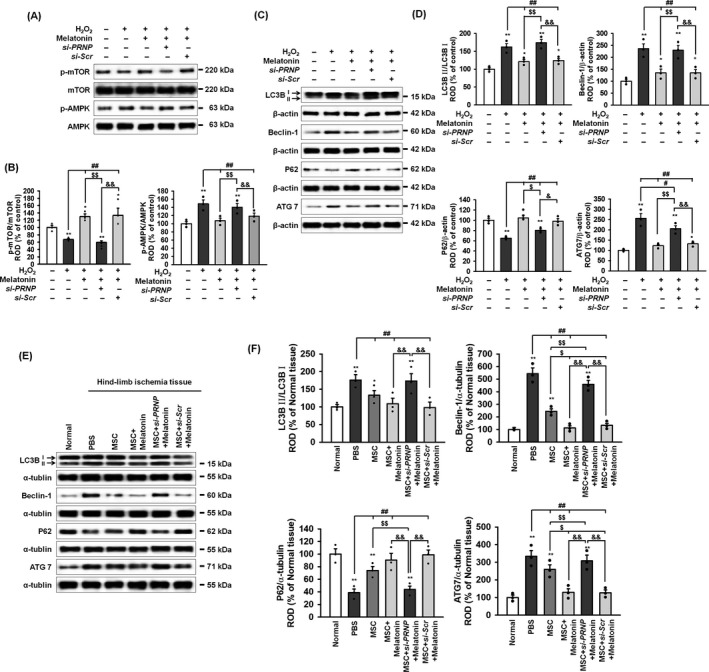
Figure 5.

Melatonin inhibits oxidative ER stress–mediated autophagy via PrPC expression. A, Western blot of p‐mTOR, mTOR, p‐AMPK and AMPK after treatment of melatonin‐pretreated MSCs with hydrogen peroxide (200 μmol/L). B, The levels of p‐mTOR and p‐AMPK were normalized to those of mTOR and AMPK, respectively. Values represent the mean ± SEM. **P < 0.05; **P < 0.01 vs untreated MSCs, ## P < 0.01 vs MSCs treated with H2O2, $$ P < 0.01 vs MSCs treated with melatonin, and && P < 0.01 vs MSCs treated with melatonin and si‐PRNP. C, Western blot of LC3B, Beclin‐1, p62 and ATG7 after treatment of melatonin‐pretreated MSCs with hydrogen peroxide (200 μmol/L). D, The levels of LC3BII were normalized to LC3B1 whereas the levels of Beclin‐1, p62 and ATG7 were normalized to β‐actin. Values represent the mean ± SEM. *P < 0.05; **P < 0.01 vs untreated MSCs, # P < 0.05; ## P < 0.01 vs MSCs treated with H2O2, $ P < 0.05; $$ P < 0.01 vs MSCs treated with melatonin, and & P < 0.05; && P < 0.01 vs MSCs treated with melatonin and si‐PRNP. E, Western blot of LC3B, Beclin‐1, p62 and ATG7 in ischaemic‐injured tissues 1 days after injection with PBS, MSCs (MSC), MSCs treated with melatonin (MSC + Melatonin), MSCs treated with melatonin and PRNP siRNA (MSC + si‐PRNP + Melatonin), or MSCs treated with melatonin and scrambled siRNA (MSC + si‐Scr + Melatonin) in a murine hindlimb ischaemia model. F, The levels of LC3BII were normalized to LC3B1, whereas the levels of Beclin‐1, p62, and ATG7 were normalized to α‐tubulin. Values represent the mean ± SEM. *P < 0.05; **P < 0.01 vs normal, ## P < 0.01 vs PBS, $ P < 0.05; $$ P < 0.01 vs MSC, and && P < 0.01 vs MSC + si‐PRNP + Melatonin
