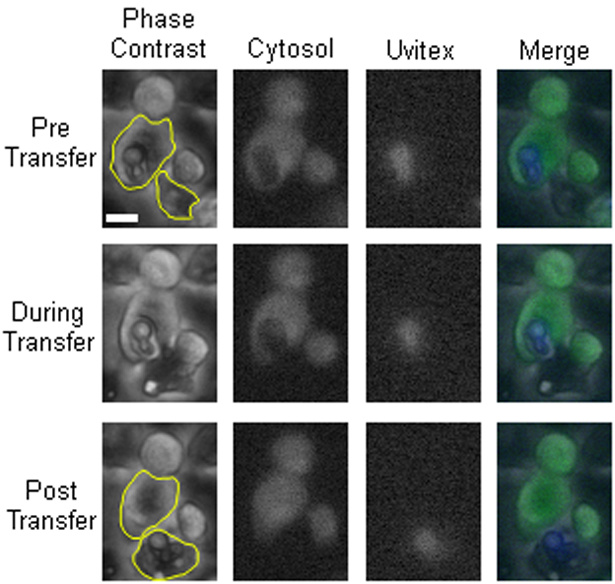
Figure 1.

Dragotcytosis event captured via fluorescent microscopy. Representative frames before (Pre), during, and after (Post) cryptococcal transfer. 10X Phase Contrast, Cytosolic CellTracker Green CMFDA (Green), Uvitex (Blue), and merged channels. The Scale bar represents 10 μm and is constant for all images. Pre, During, and Post Transfer images were obtained from movie frames 266, 274, and 278, respectively. Representative regions of interest have been outlined (yellow) to demonstrate areas analyzed for fluorescence. These images are from Event 4 in subsequent graphs.
