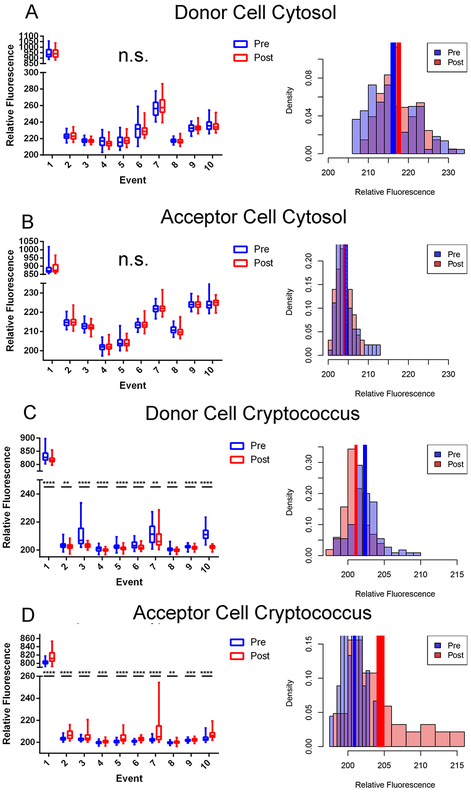
Figure 2.
Quantifications of stains from Dragotcytosis events in biological replicates. A. Donor cell cytosol as measured by CellTracker Green CMFDA intensity before (blue) and after (red) transfer. B. Acceptor cell cytosol as measured by CellTracker Green CMFDA intensity before and after transfer. Intensity values remain at background levels in each replicate. C. Presence of cryptococcal cell inside Donor cell measured as Uvitex intensity before and after transfer. D. Presence of cryptococcal cell inside Acceptor cell measured as Uvitex intensity before and after transfer. Significance was determined by unpaired two tailed t-test with (****) representing a P value of < 0.0001, (***) representing a P value of <0.001, and (**) representing a P value of <0.01. Data for each population is each individual pixel intensity measurement, with bars representing minimum-maximum spans in box-whisker format. Density (pixel intensity frequency) histograms represent pixel population data specifically for Event 4 with solid colored rectangles representing mean +/− standard error. Data for each event consists of intensity measurements from each pixel within the acceptor or donor cell. The relative fluorescence of Event 1 is higher than the other events because that measurement came from the initial experiment before dyes were titrated for optimization. Each of these events corresponds to a single event in which a single yeast is transferred from one macrophage to another with the exception of event 8 which spans two individual transfer events in which one yeast cell is transferred during each event. This was due to the necessity of acquiring clear frames for quantification.

