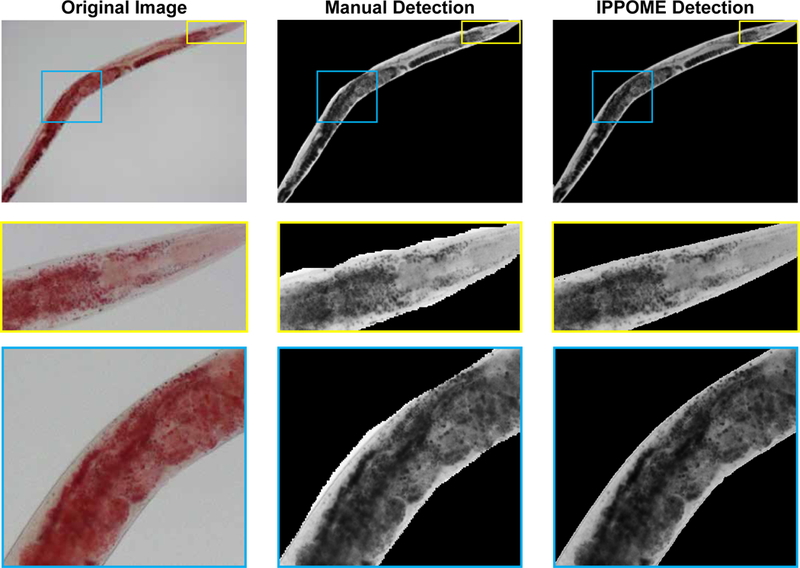
Figure EV1 – Manual animal detection versus IPPOME detection.

The same image was analyzed by hand using a computer mouse versus automatic analysis by IPPOME. Yellow and blue boxes indicated enlarged areas to compare manual and IPPOME outlining and detection.
