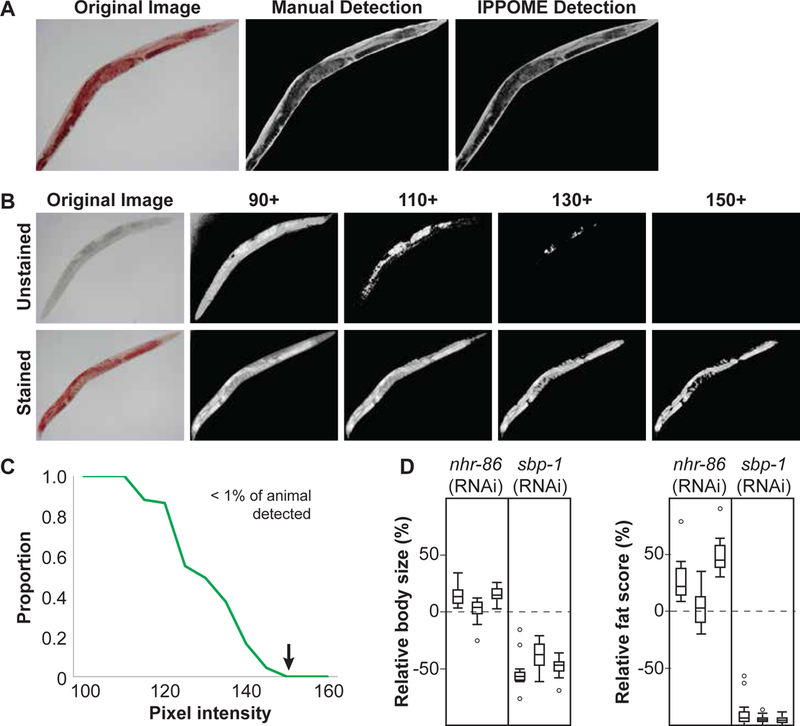
Figure 2-. Automated image analysis by IPPOME.

A Comparison between manual and IPPOME-derived delineation of a C. elegans body. An example of a bright field image of an ORO-stained animal (left panel), that same image manually delineated using ImageJ by outlining the animal with a computer mouse (middle panel), and the same image automatically delineated by IPPOME (right panel).
B ORO detection threshold. Determination of baseline pixel intensity for fat content analysis with ORO staining. Original bright field images are located at the far left, with an example of an unstained animal on the top row, and an ORO stained animal on the bottom row. Pixel intensity was inverted in each image. A pixel intensity of 150 was selected as the threshold for fat content analysis because unstained animals are no longer detected while ORO staining is detected.
C IPPOME ORO detection threshold. The proportion of the detectable animal (defined as the number of pixels) with a threshold of pixel intensity of 150 was evaluated by comparing ORO stained and unstained animals in Fig 2B. The green line represents the proportion of the unstained animal visible at the given pixel intensity. The arrow indicates the selected threshold of pixel intensity (150) for ORO staining when less than 1% of the unstained animal is visible.
D Boxplots of the relative body size (left) or fat score (right) for nhr-86 and sbp-1 knockdowns. Each boxplot corresponds to an independent experiment of an average of 17 animals each. The dashed line at 0% indicates the normalized average body size or fat score of paired control animals. Three independent experiments of 17 animals each are shown.
