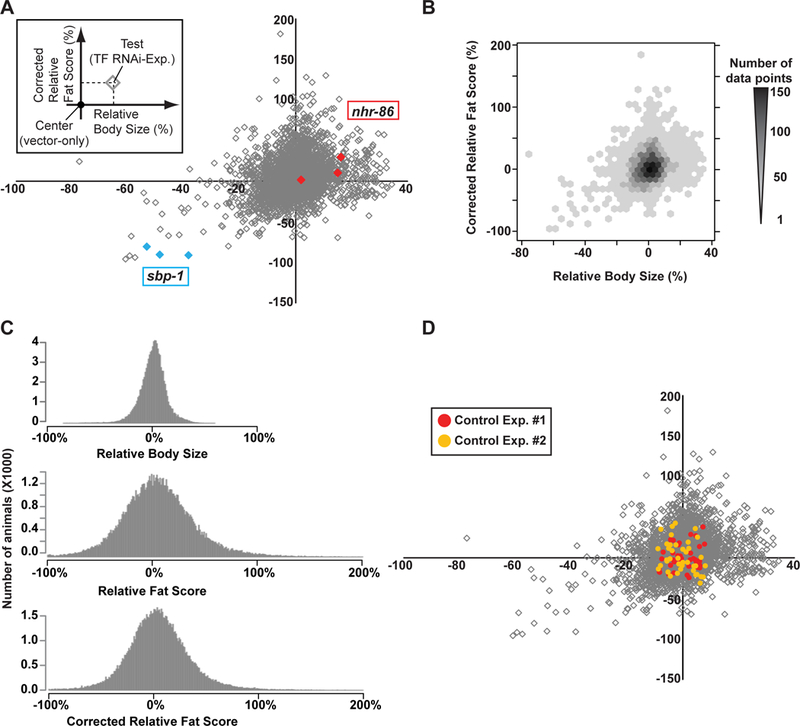
Figure 3-. Distribution of body size and fat content phenotypes.

A Relative body size versus corrected relative fat score of all TF knockdowns. Comparative results across the entire experiment of the relative body size (x-axis) and corrected relative fat score (y-axis) of RNAi-mediated TF knockdown animals normalized to the respective scores of paired vector-fed animals. The vector-fed control animals are located at the center (0, 0) of this plot. Each data point represents the average of the corrected relative fat score and the relative body size of the RNAi-mediated TF knockdown per single RNAi experiment (average of ~17 animals each). A complete list of TFs with all scores is available in Dataset EV3. RNAi experiments for sbp-1 (blue) and nhr-86 (red) are shown as examples of lean and small, or fat and large, respectively.
B Density plot of relative body size and corrected relative fat score distributions of all TF RNAi experiments. The x-axis and y-axis indicate the relative body size and corrected relative fat score of RNAi-treated animals, respectively. Darker color hexagons indicate higher density of data points of RNAi-treated animals while lighter color shows lower density of data points.
C Comparison of the distributions of relative body size, relative fat score and corrected relative fat score for the entire dataset.
D Distribution of relative body size and corrected relative fat score of vector-control fed animals. All scores are normalized by the average of all measurements. Red and yellow indicate two independent experiments. In the first experiment, 38 vector only controls were performed, and in the second experiment 40. The gray diamonds indicate the total TF RNAi data shown in Fig 3A.
