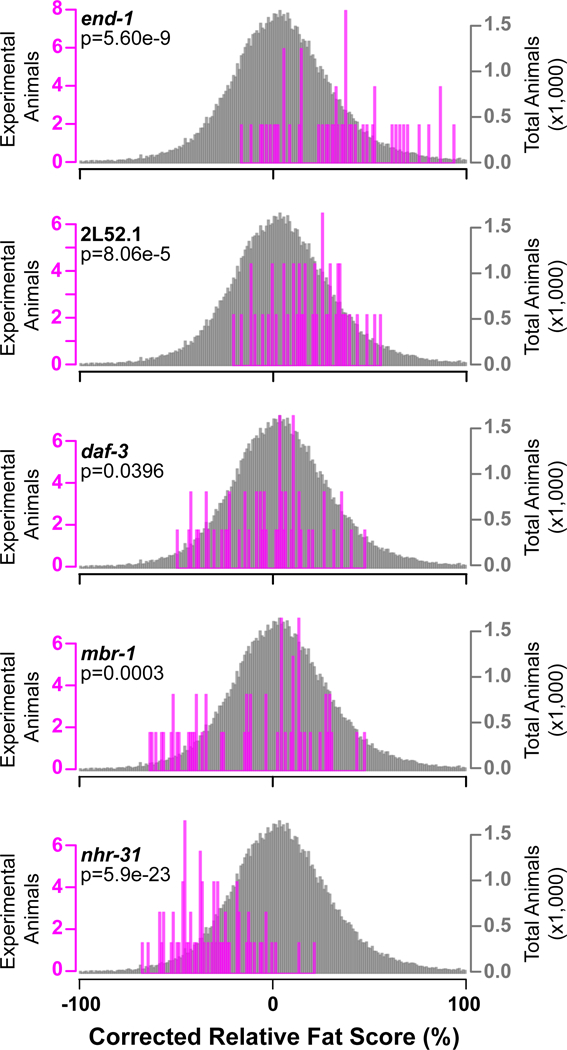
Figure 5-. Examples of TFs affecting C. elegans fat content.

KS-Test of each individual animal for the RNAi phenotype of the gene listed on the left (magenta bars) versus the entire dataset (~45,000 animals, gray bars). Examples of RNAi-mediated knockdown causing fat (end-1), above average fat (2L52.1), average (daf-3), below average lean (mbr-1) or lean (nhr-31) phenotypes. Three combined independent experiments are shown with an average of 51 animals each.
