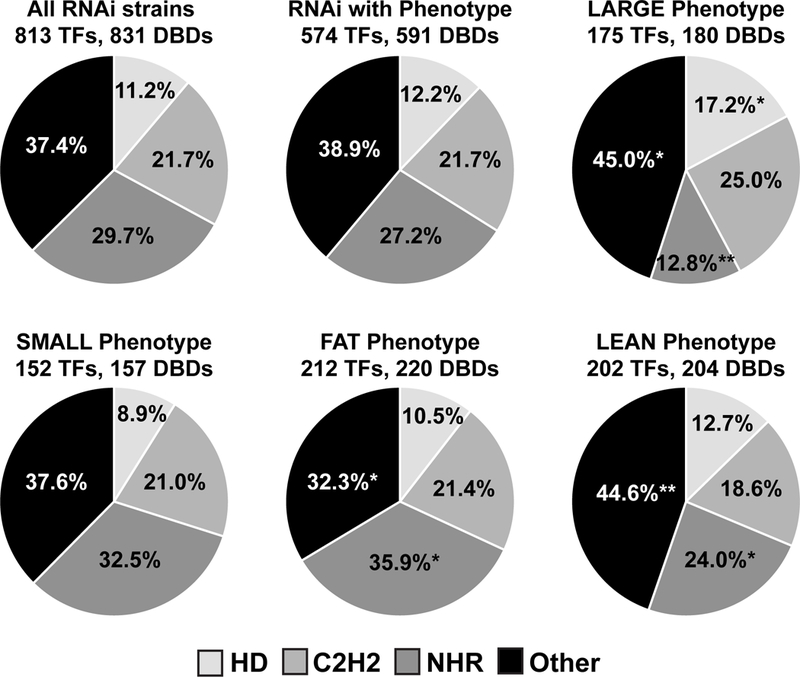
Figure 7-. TF family analysis.

Pie charts showing the percentage of DNA binding domains (DBDs) present per phenotype. The top row indicates all of the DBDs from the total set of TFs tested (813 TFs with 831 DBDs – note that TFs that confer additional phenotypes were not included in this analysis), while the other rows show the percentage of the three most common C. elegans DBD family per phenotype (FDR < 0.1). Enrichment or depletion of a DBD per phenotype was calculated by hypergeometric distribution. *p < 0.05, **p < 0.01.
