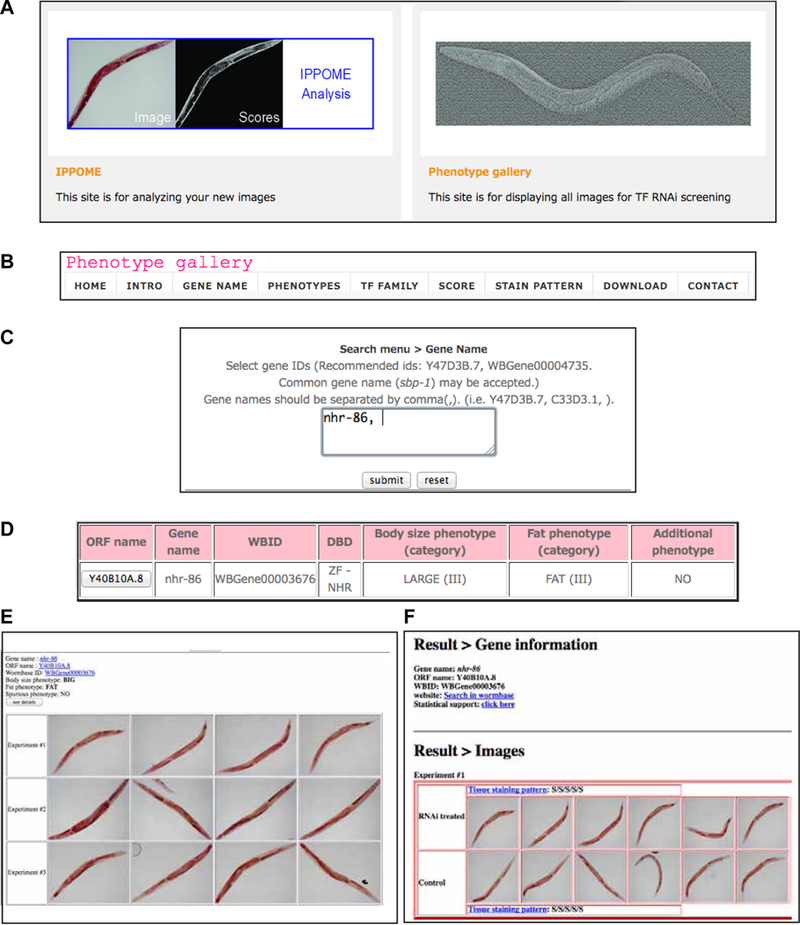
Figure 9-. Web based phenotype gallery.

The web based image gallery can be accessed at http://ippomeweb.umassmed.edu/.
A Website main page with access to IPPOME for image analysis on the left, and access to the Phenotype Gallery on the right.
B The Phenotype Gallery menu.
C Search by sequence name, WormBase ID, or gene name.
D Results of searching for nhr-86 reveals the phenotype of the RNAi knockdown leads to a large (FDR < 0.001) and fat (FDR < 0.001) phenotype.
E Clicking on the ORF name in part D displays the experimental images.
F Further clicking on the “see details” button from part E displays the experimental images and the paired controls, plus tissue staining patterns. Further clicking after “Statistical Support” displays the KS-statistics for the entire dataset and for each experiment.
