


Figure 2.
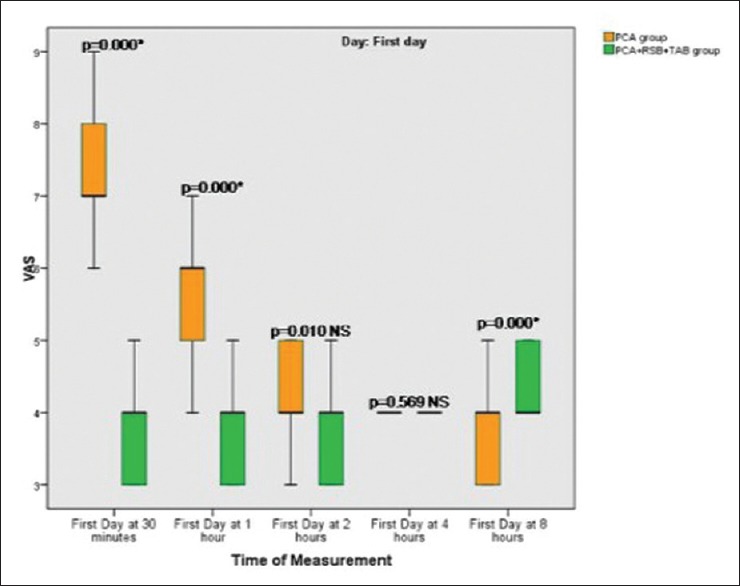
Box plot graph of Visual Analogue Scale (VAS) on movement on postoperative Day 1 showing; median values (line within the box) and inter-quartile range for 25 patients in intravenous fentanyl patient controlled analgesia group (PCA) + placebo saline injection in RSB and TAP group, and 30 patients in multimodal analgesia group (PCA + 0.25% bupivacaine in RSB and TAP). P < 0.01, changes considered significant. *Significant. NS = P >0.01 which considered not significant