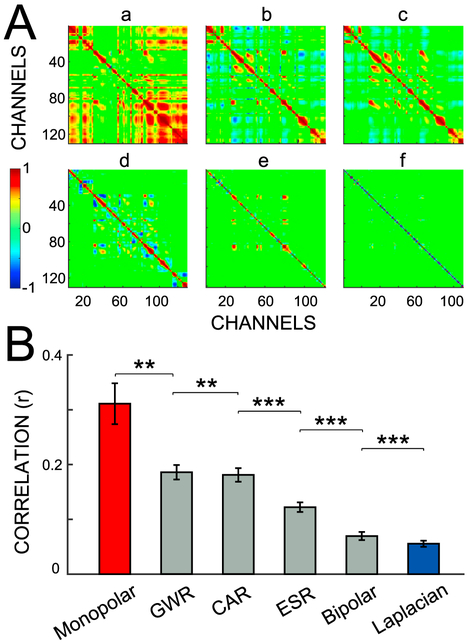
Fig. 4.
Signal correlation for different referencing methods. (A) Correlation matrix from Subject 12 for the six referencing methods: (a) monopolar; (b) GWR; (c) CAR; (d) ESR; (e) bipolar; and (f) Laplacian. Colors correspond to the correlation between two specific channels. The correlation between channels varies across the methods. (B) Average Pearson's correlation and standard error for the six referencing methods. Asterisks denote the significance of the difference between correlations established using paired t-tests: *** (p < 0.001), ** (p < 0.01). These statistical results are shown only for the nearest pairs that show a significant difference.

