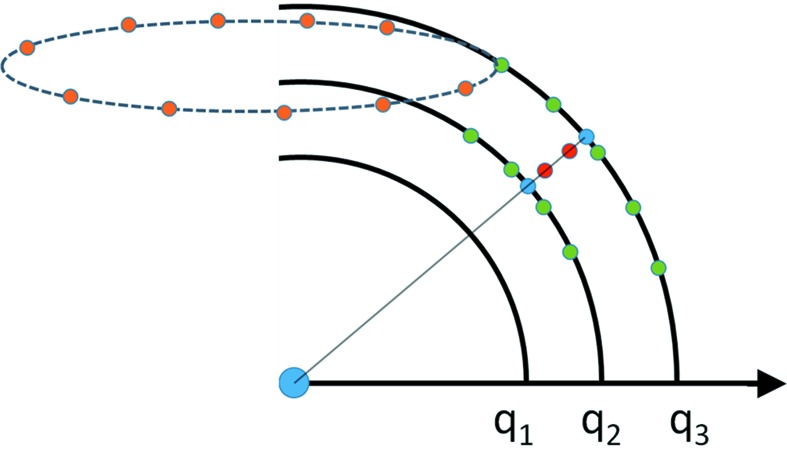
Figure 2.

Illustration of the interpolations used in D+. To compute a specific q = (q i, θi q, ϕi q) point (indicated in red), we first interpolate the ϕq values in the grid (the orange points show a few grid points), which are periodic (along the broken circle) and evenly spaced. We get the green points that are lying in the (q, θq, ϕi q) plane (solid thick black curves), shown in the figure. We then use the green points to interpolate the θq values and obtain the blue points, which are on the (q, θi q, ϕi q) line (solid thin line). Finally, we use the blue points to interpolate at the required q values (red points). The interpolation is done simultaneously for all the red points that are located between adjacent blue points.
