Figure 6.

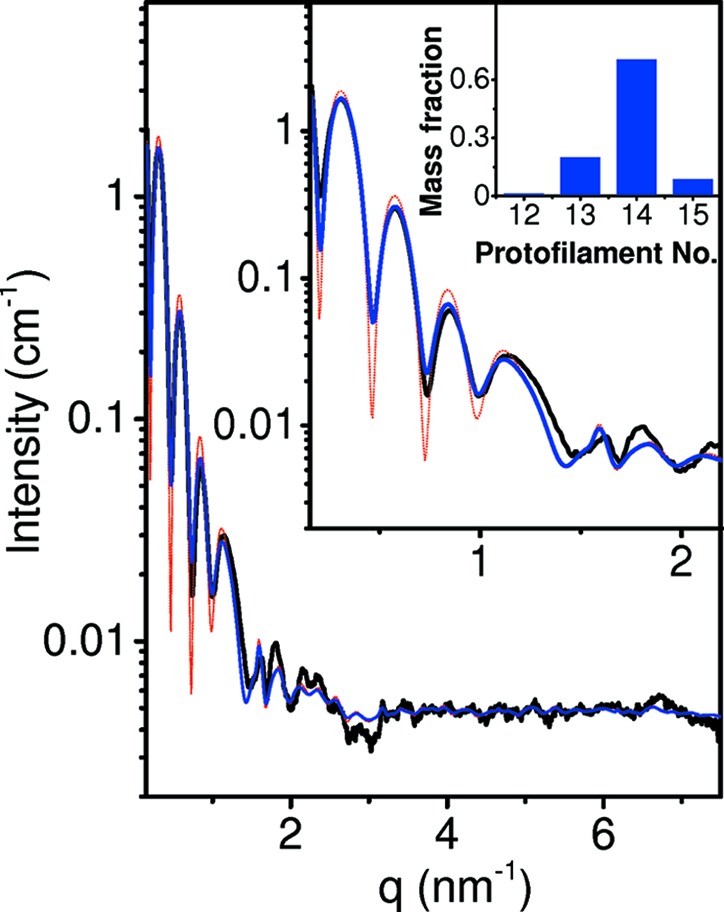
Solution X-ray scattering data and models of dynamic solvated microtubules. Azimuthally integrated background-subtracted scattering intensity (obtained as explained in SOM Section 5 and Fig. S2), as a function of q, from solutions of 0.2 mM tubulin that was polymerized in the presence of 4 mM GTP. The sample was polymerized and measured at 309 K. The black curve represents the scattering data measured at the SWING beamline at the Soleil synchrotron. Similar data were obtained at the ID02 beamline at ESRF. The thin red curve is based on an atomic MT model with 14 protofilaments, each containing 48 tubulin dimers along the long MT axis. The tubulin dimers were arranged in a three-start left-handed helical lattice. The radius and pitch that best fitted the data were 11.9 and 12.214 nm, respectively, in agreement with PDB 3j6f (Alushin et al., 2014 ▸). A solvation layer was added to the entire MT structure, using a Probe Radius of 0.14 nm and the solvation overlap correction method explained in SOM Section 10.2. The shell was 0.28 nm thick and its electron density was 364 e nm−3. The thick blue curve is the computed scattering curve, which is based on a fit to a linear combination of similar solvated atomic MT models with radii of 10.2, 11.05, 11.9 and 12.75 nm, corresponding to 12, 13, 14 and 15 protofilaments. The pitch in all the models remained 12.214 nm. A Gaussian resolution function with a full width at half-maximum of 0.01 nm−1 was applied to all individual models forming the blue curve. The larger inset shows the low-q range on an expanded scale. The mass fraction distribution of the population that best fits the data is shown in the smaller inset. Intensity curves were computed on an NVIDIA Titan GPU, using the hybrid method.
