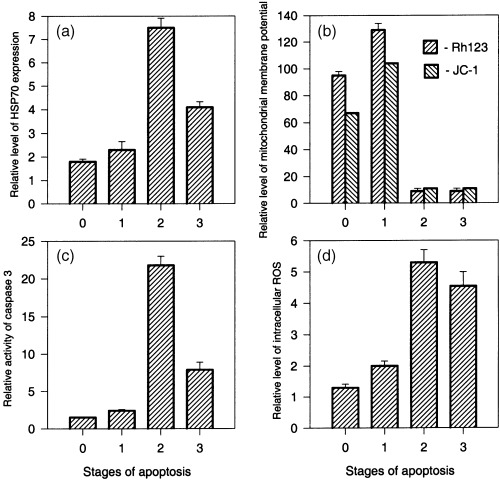
Figure 3.

Surface HSP70 expression, mitochondrial membrane potential, caspase‐3 and ROS activity at progressive stages of EL‐4 cell death. (a) HSP70 expression; (b) mitochondrial transmembrane potential; (c) caspase‐3 activity, and (d) intracellular concentration of ROS during the progress of programmed EL‐4 cell death. Results are presented as the mean of fluorescence intensity ± SEM. Data are representative of three comparable experiments.
