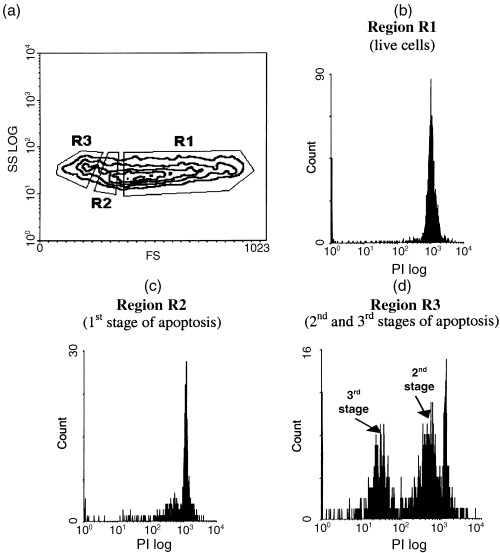
Figure 4.

Identification of different stages of apoptosis in EL‐4 cells prepared for measuring intracellular proteins by fixation and permeabilization (see Materials and Methods ) and stained with PI. (a) Regions of live and apoptotic cells selected by their morphological features (forward and side scatter); (b) measurement of PI fluorescence in region R1 demonstrating that the majority of cells within this region are live cells; (c) PI staining cells from region R2 showing that this region contains cells at an early phase of apoptosis (first stage for our model); (d) PI staining showed the presence within region R3 of two hypodiploid peaks with differing intensity of fluorescence, allowing a distinction to be made between this region in the intermediate (second stage) and terminal (third stage) phases of apoptosis.
