. 2019 Mar 21;10(17):4673–4683. doi: 10.1039/c9sc00199a

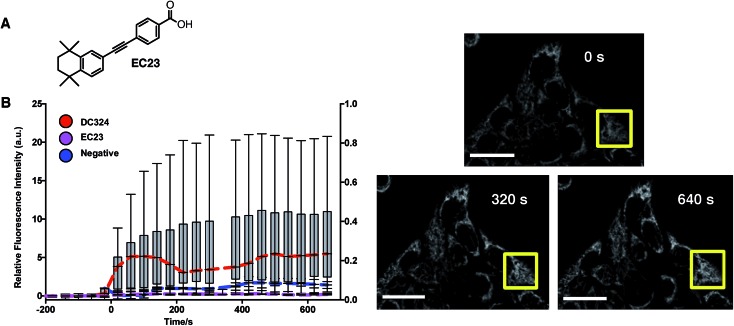
Fig. 7. (A) Chemical structure of synthetic retinoid, EC23. (B) Quantitation of relative fluorescence of CellRox before and after irradiation using a 405 nm laser. The relative fluorescence intensity was calculated in the region of interest (ROI, yellow box) at each time point and data graphed using box-whisker plot. Graph coloured lines denote sample mean (n = 11, DC324; n = 3, EC23; n = 3, negative) from 2 experimental replicates for each treatment (red = DC324, pink = EC23, blue = negative). Time 0 equals time of irradiation. Increased fluorescence intensity in DC324-treated cells was significant as determined by one-way ANOVA (p < 0.001). Scale bars equal 50 μm.

Fig. 7