. 2019 Mar 1;10(17):4640–4651. doi: 10.1039/c8sc05611k

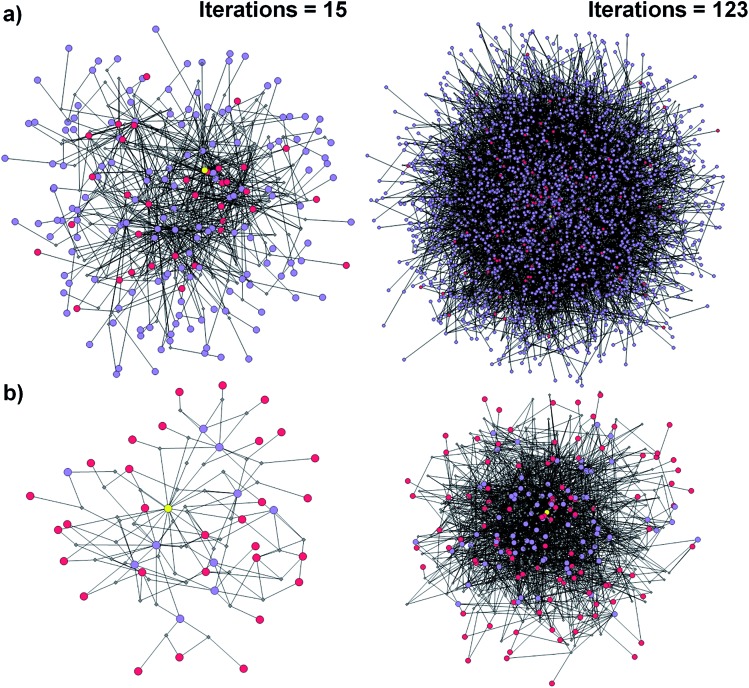
Fig. 1. Reaction networks/graphs inspected during synthetic searches and the subgraphs of viable solutions. (a) The graphs of all molecule nodes visited during Chematica's retrosynthetic searches for the syntheses of the triarylamine target (same as in Fig. 6). The network on the left is for the early stage of the search (15 iterations of expanding retrons into progeny synthons; overall within ∼20 s computing time on a 64-core machine) and contains 456 nodes (i.e., all molecules and reactions considered during the search). The graph on the right is later in the search (123 iterations within <2 min of computing time on a 64-core machine) and contains 5300 nodes. (b) The corresponding subgraphs of the networks from (a) contain only the viable syntheses. Note that as the search progresses, the subgraphs of solutions are themselves becoming quite complex, here increasing from 90 nodes after 15 iterations to 779 nodes after 123 iterations. Color coding of the nodes: yellow = target; violet = intermediates; red = commercially available starting materials; small gray diamonds = reaction nodes.

Fig. 1