. 2019 Mar 1;10(17):4640–4651. doi: 10.1039/c8sc05611k

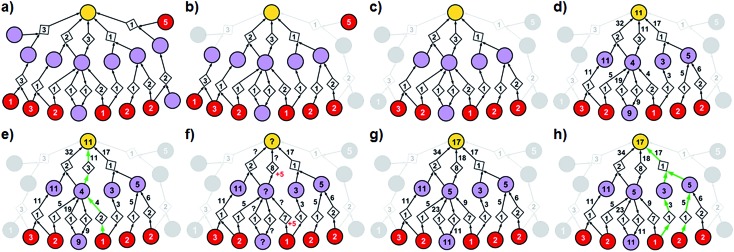
Fig. 3. Stages of selecting cost-effective yet diverse pathways from a synthetic graph. Parameters used are 50% yield for all reactions and penalty P = 5. (a) A hypothetical chemical reaction network created during a retrosynthetic search. Hypothetical costs of substrates per mmol are given over red nodes and fixed costs of reaction operations are indicated inside the diamond-shaped reaction nodes. Note that not all pathways terminate in commercially available starting materials (red nodes) as the search algorithm visited/probed some intermediates that did not lead to complete synthetic solutions. Such nodes and the pathways they are involved in are removed from consideration in (b) and (c). (d) The costs of all nodes in the remaining subgraph are computed by propagating from starting materials to the target as described in detail in the main text (see also Fig. 4). (e) The lowest-cost synthesis of the target is selected and here indicated in green. (f) Penalty P is added to the reactions from the selected pathway (here, P = +5, red numbers). Nodes whose costs increase due to such penalization are marked with question marks and are recalculated as in (g). The new “best” synthetic pathway is selected in (h) and the penalization-selection cycle can be again repeated as needed.

Fig. 3