
Figure 1.
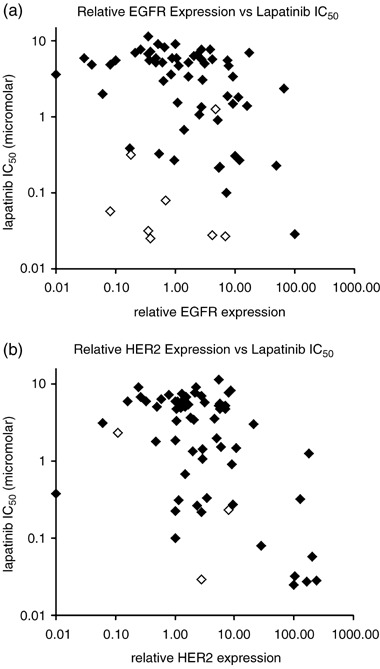
Scatter plots showing the relationship between individual receptor expression and cellular pIC50. (a) EGFR expression and cellular IC50. A number of cell lines with high levels of HER2 (open diamonds) are responsive to lapatinib, despite modest levels of EGFR expression. (b) HER2 expression and cellular IC50. Two of the three cell lines with high levels of EGFR expression (open diamonds) are responsive to lapatinib, despite modest levels of HER2 expression.