
Figure 2.
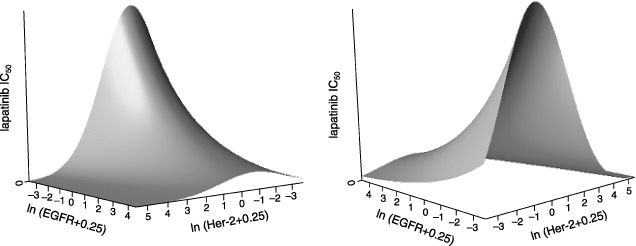
Fitted surfaces showing the effect of EGFR and HER2 expression on response to lapatinib. The natural log of EGFR and HER2 expression is plotted against the IC50 for lapatinib in a three‐day cellular proliferation assay. One cell line had an EGFR expression level and one cell line had an HER2 expression level below the limit of detection which was defined as zero. For this reason, a value of 0.25 was added to the expression level of EGFR and HER2 for all cell lines. Left panel: As EGFR expression increases, there is a commensurate drop in cellular IC50. As HER2 expression increases, there is quadratic relationship between the natural logarithm of expression and efficacy. Tissue of origin for each cell line was also used to generate the fitted surface. Right panel: the same surface rotated to more readily visualize the predicted IC50 at higher levels of HER2.