
Figure 5.
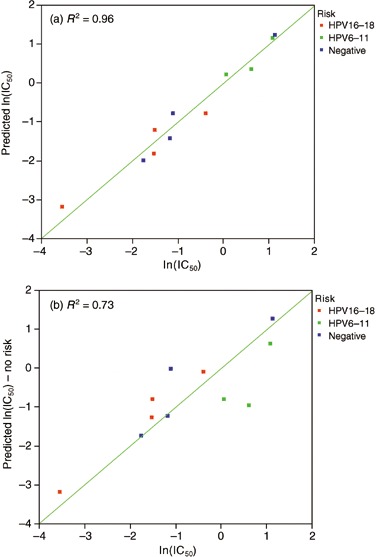
HNSCC tumor cell lines, plot of the natural log of predicted versus actual IC50 value on the log base 10 scale. Multivariate assessment of the effect of HPV risk and EGFR/HER2 expression on lapatinib sensitivity (a) is a better predictor of lapatinib sensitivity than assessment of only EGFR and HER2 expression (b).