
Figure 2.
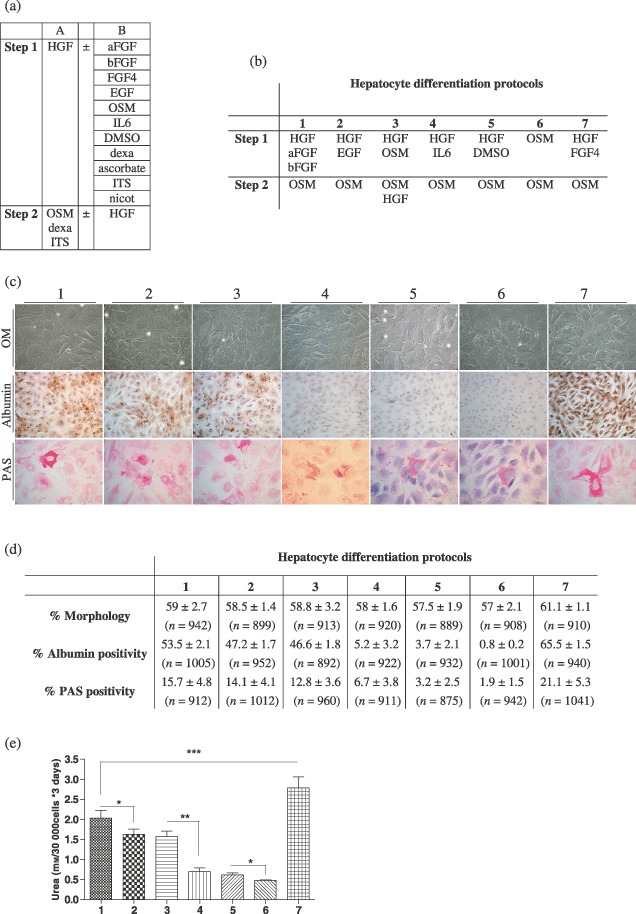
Description of the data collected for the elaboration of the complete hepatocyte differentiation protocol. (a) Description of the cytokines and factors tested in combinations (n = 30) following a two‐step procedure. Column A describes the factors invariably used in the protocols. Column B lists the factors that were added independently or in a combined manner (for step 1). (b) Description of the most representative hepatocyte differentiation protocols designed by combination of the cytokines/factors described in table A. Factors as dexa (dexamethasone), ascorbate (ascorbid acid 2‐phosphate), ITS and nicot (nicotinamide) were not considered in the description. (c) Pictures showing the results obtained after completion of the protocols described in table B (30 days procedures) in terms of morphology analysed by optic microscopy (OM), albumin content assayed by immunocytochemistry and glycogen storage depicted by periodic acid‐Schiff (PAS) staining. Morphology and PAS staining pictures were taken at magnification ×400. Albumin staining pictures were taken at magnification ×200. (d) Calculation, for each group of differentiation, of the amount of cells displaying a hepatocyte‐like morphology or a positive staining for albumin or glycogen. Whereas similar morphological changes were observed in each procedure, the highest albumin and glycogen‐positive cell content was noticed in protocol no. 7. Values are presented as mean ± SD. Total cell count for each experiment is provided between brackets. (e) Values of urea secretion for each differentiation protocol at 30 days (n = 6 for each experiment). Urea production of the protocol no. 7 was significantly higher than all of the other protocols. P values are indicated in the graph (*P < 0.05, **P < 0.01, ***P < 0.001).