
Figure 6.
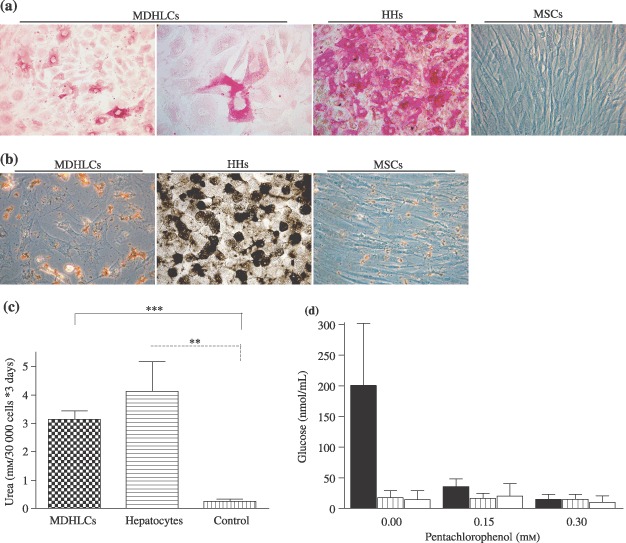
Functional characterization of MDHLCs. (a) Periodic acid‐Schiff (PAS) staining showing cytoplasmic glycogen deposition in MDHLCs as compared to HHs and MSCs. (b) G6Pase assay (n = 5) showing lack of enzyme activity in MDHLCs revealed by absence of brownish lead sulphide cytoplasmic precipitate. Positive and negative controls were performed respectively on HHs and MSCs. Similar results were obtained with overnight 5 mm G6Pate incubation. Pictures were taken at magnification ×400. (c) Colorimetric assay showing significant urea production in MDHLCs (n = 4) as compared to MSCs (n = 4). By comparison, no difference could be observed between the urea production of MDHLCs and mouse hepatocytes. (d) Gluconeogenesis assay showing the decrease of glucose neoformation in mouse hepatocytes (plain bars) after exposure of growing concentrations of pentachlorophenol. No glucose production was observed in MDHLCs (shaded bars) or in MSCs (empty bars) (n = 3 each). HHs, human primary hepatocytes; MDHLCs, mesenchymal‐derived hepatocyte‐like cells; MSCs, mesenchymal stem cells.