
Figure 1.
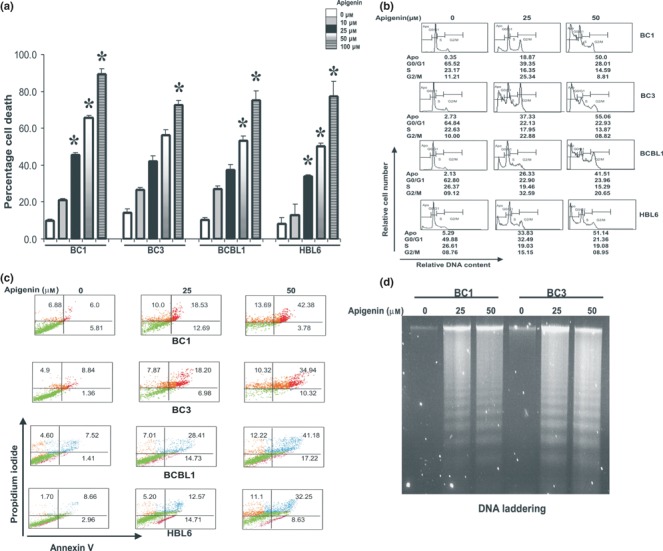
(a) Apigenin suppresses growth of PEL cells. BC1, BC3, BCBL1 and HBL‐6 cells were incubated in 0–100 μm apigenin for 24 h. Cell death assays were performed using trypan blue exclusion dye as described in the Materials and methods section. The graph displays mean ± SD (standard deviation) of three independent experiments with replicates of six wells for all doses, and vehicle control for each experiment. *P < 0.05, statistically significant (Student’s t‐test). (b) Apigenin treatment increases G2/M population at 25 μm and sub‐G1 (apoptotic) populations at 50 μm. BC1, BC3, BCBL1 and HBL‐6 cells were treated with 25 and 50 μm apigenin for 24 h. Thereafter, the cells were washed, fixed and stained with propidium iodide, and analysed for DNA content by flow cytometry as described in the Materials and methods section. At least three independent experiments were performed for all cell lines. Results from one representative experiment shown. (c) Apigenin‐induced apoptosis detected by Annexin V/PI dual staining. Cells were treated with 25 and 50 μm apigenin (as indicated) for 24 h and were subsequently stained with flourescein‐conjugated annexin‐V and propidium iodide (PI) and analysed by flow cytometry. (d) BC1 and BC3 cells were treated with 25 and 50 μm apigenin for 24 h and DNA was extracted and separated by electrophoresis on 1.5% agarose gel.