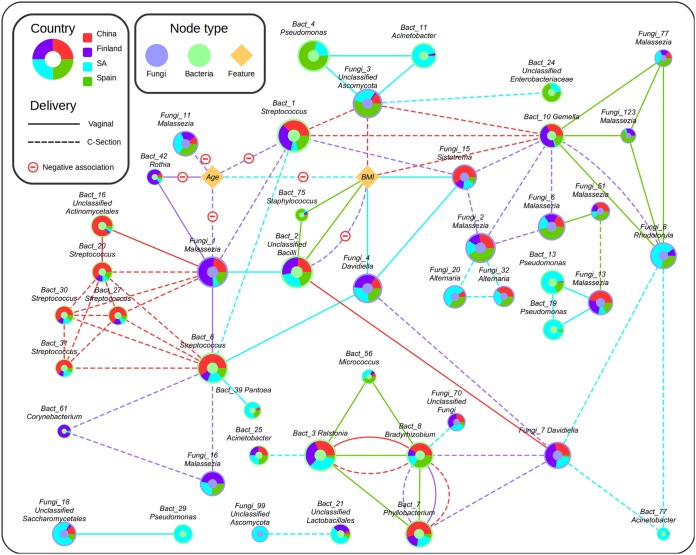
FIG 3.
Cooccurrence network of bacteria and fungi in breast milk samples depending on maternal features and delivery mode. Green nodes represent bacterial OTUs, blue nodes represent fungal OTUs, and yellow nodes represent features. Node size indicates OTU abundance. Pie chart colors represent the overall distribution of each OTU across country. Each link indicates a significant (P < 0.05) interaction between OTUs or features in samples from a given combination of country and delivery mode (vaginal, C-section). Link color denotes the country, and line type indicates delivery mode. SA, South Africa.

