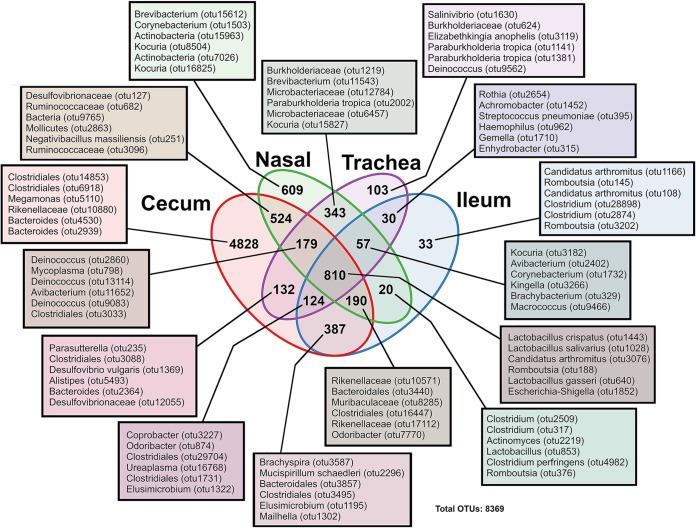
FIG 4.
Venn diagram depicting the number of OTUs that were shared between body sites or unique to a given body site. The OTUs listed are the top 6 most abundant OTUs in that group; full lists of OTUs are provided in Data Set S1 in the supplemental material. The taxonomy given is of the lowest level assigned by SILVA database. Nasal, nasal cavity.

