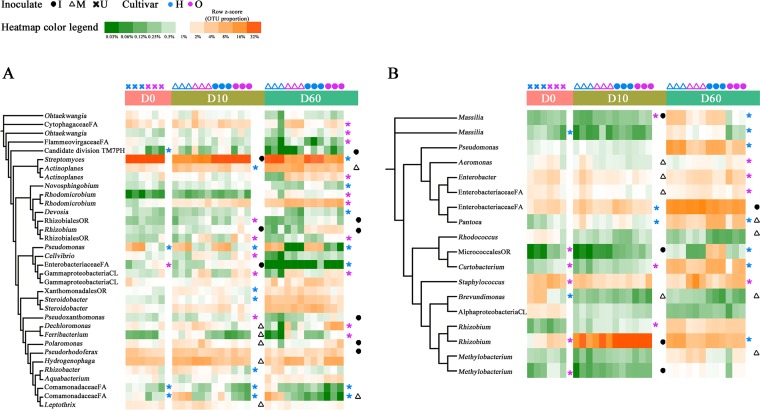
FIG 4.
Phylogenetic distribution and heatmaps of the most abundant OTUs (with abundance >0.5%) in the endophytic microbiota of peach tree roots (A) and twigs (B) under different sampling times, cultivars, and treatments. The phylogenetic trees were constructed with 1,000 bootstrap resamplings and annotated using iTOL. Branch lengths are arbitrary. The highest taxonomic resolution of OTUs is labeled. Heatmaps show the relative abundances of OTUs across sample types and replicates. P values are calculated according to the Kruskal-Wallis analysis, and significant differences (P ≤ 0.05) are indicated with asterisks. U, uninoculated; M, mock; I, inoculated with A. tumefaciens; FA, family; PH, phylum; OR, order; CL, class; H, “Honggengansutao”; O, “Okinawa.”

