
Figure 5.
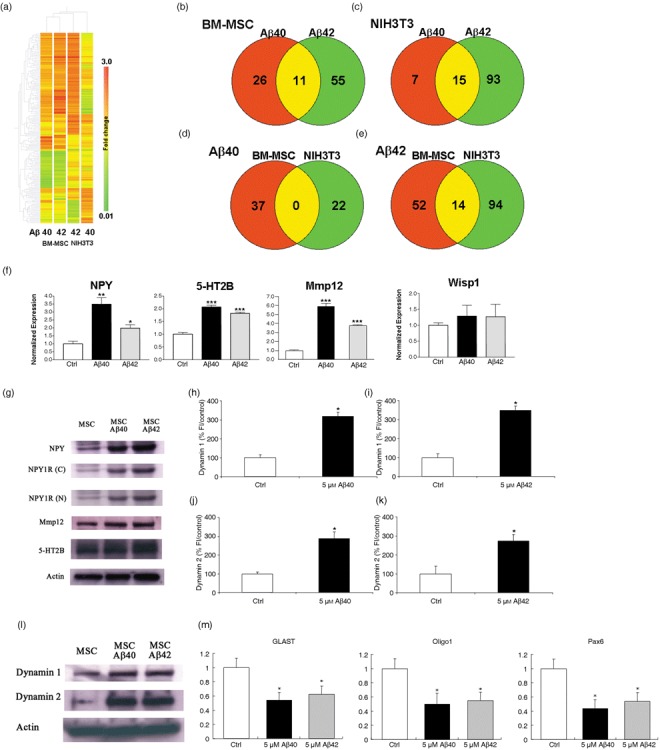
Amyloid beta (Aβ) induces neurogenesis via the action of NPY and dynamin associated GPCR signalling and this is mediated by activation of ERK1/2‐directed signalling pathways. Hierarchical clustering and Venn diagrams demonstrate the difference in transcript distribution between bone marrow‐derived mesenchymal stem cells (BM‐MSC) and NIH3T3 cells treated with either Aβ1–42 or Aβ1–40. (a) Hierarchical clustering analysis of a list of significantly differentially expressed transcripts (228 transcripts). Transcripts that had a raw signal of greater than 50 in at least one experimental condition were filtered by Student's t‐test at P < 0.05. Columns of BM‐MSCs and NIH3T3 cells treated with Aβ peptides only are shown. Transcripts are ordered by default gene trees generated in GeneSpring 7.3. (b,c) Venn diagrams showing transcript distribution in NIH3T3 and BM‐MSC elicited in response to Aβ treatment. Aβ1–42 peptide induces more gene expression change than Aβ1–40 in both cell types (66 and 108, BM‐MSC and NIH3T3 respectively). (d) Aβ1–40 induces no overlap in expressed genes in both cell types whereas (e) Aβ1–42 induces minimal overlap of shared genes (14/160 = 8.8%). The diagrams were generated from lists of transcripts that are > 1.5‐fold enriched or < 0.67 depleted, relative to non‐treated control. (f) Real‐time polymerase chain reaction (PCR) was used to validate microarray analysis for four genes: NPY, 5‐HT2B, MMP12 and Wisp 1. There was a significant increase in expression of the genes NPY, 5‐HT2B and MMP12 for both Aβ treatments relative to that in control untreated cells. Changes in Wisp1 expression are not significant. For each transcript, amplicon abundance is normalized to GAPDH abundance because this housekeeping gene is approximately equal across all microarray chips. The normalized amplicon levels are then expressed as a mean ratio versus that measured in untreated BM‐MSC ± SEM *P < 0.05; **P < 0.01; triple asterisk, P < 0.001, relative to control (Student's t‐test). (g) Representative Western blot analysis shows increased expression of NPY and its Y1 receptor (using antibodies NPY1R‐N‐terminus, 11 kDa and NPY1R‐C‐terminus, 11 kDa). NPY and the Y1 receptor are endogenously expressed in BM‐MSC. Treatment with Aβ1–42 and Aβ1–40 induced an increase in NPY and NPY1R. Protein expression for MMP12 was increased for each Aβ peptide treatment compared to control. Protein expression using the 5‐HT2B polyclonal antibody produced an equivocal result. (h–l) BM‐MSC cultures treated with 5 µm Aβs for 5 days showed a significant increase in fluorescent staining intensity for both dynamin 1 and 2 staining together with an increase in protein expression. *P < 0.0001, relative to control. (m) Quantitative real‐time PCR demonstrating neuronal‐specific down‐regulation of GLAST, Oligo1 and Pax6 genes in response to Aβ treatment using NPY‐deficient mice. *P < 0.001, relative to control.