
Figure 5.
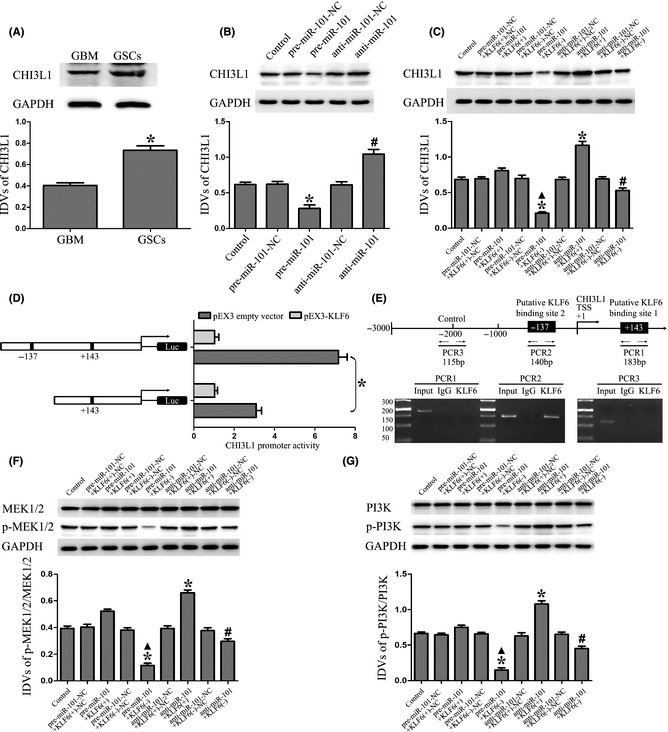
Overexpression of miR‐101 inhibited the expression of CHI3L1 and activation of MEK1/2 and PI3K pathways by downregulating KLF6. (A) CHI3L1 protein expression in GBM and GSCs. *P < 0.05 versus GBM group. (B) Western blot analysis of the CHI3L1 expression regulated by miR‐101 in GSCs. * P < 0.05 versus pre‐miR‐101‐NC group, # P < 0.05 versus anti‐miR‐101‐NC group. (C) Western blot analysis of the CHI3L1 expression regulated by miR‐101 and KLF6 in GSCs. The IDVs of CHI3L1 are shown using GAPDH as an endogenous control. *P < 0.05 versus control group, ▲ P < 0.05 versus pre‐miR‐101+KLF6(+) group, # P < 0.05 versus anti‐miR‐101+KLF6(+) group. (D) KLF6 on promoter activity of CHI3L1 in GSCs. The deletion construct on the promoter of CHI3L1 is shown in Y‐bar. X‐bar shows the promoter activity which has been normalized with the reference vector (pRL‐TK) and relative to the activity of pEX3 empty vector. (E) KLF6 bound to the promoter of CHI3L1 in GSCs. Putative KLF6 binding sites are indicated. ChIP analysis of immunoprecipitates from GSCs using normal rabbit IgG as a negative control. The immunoprecipitates were analyzed by PCR. (F) Western blot analysis of the p‐MEK1/2/MEK1/2 expression regulated by miR‐101 and KLF6 in GSCs. (G) Western blot analysis of the p‐PI3K/PI3K expression regulated by miR‐101 and KLF6 in GSCs. Data are presented as the mean ± SD (n = 5, each group). *P < 0.05 versus control group, ▲ P < 0.05 versus pre‐miR‐101+KLF6(+) group, # P < 0.05 versus anti‐miR‐101+KLF6(+) group.