Figure 3.

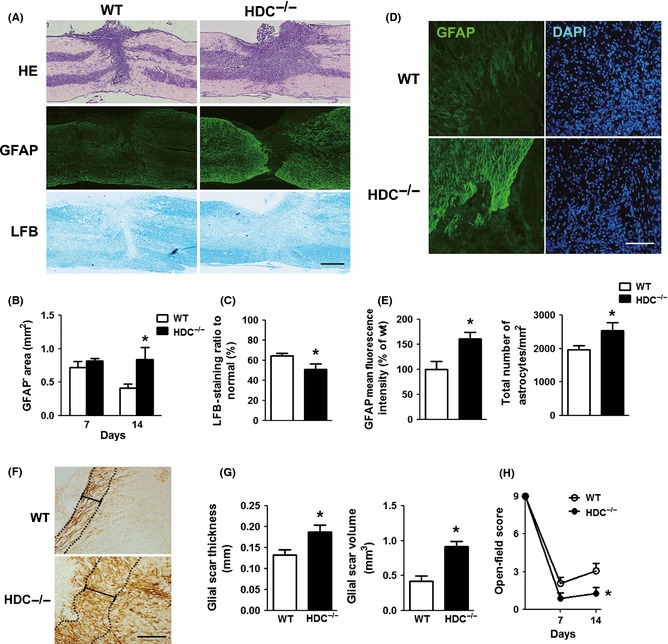
Aggravation of spinal cord damage in HDC −/− mice after SCI. (A) Representative photographs from HE, GFAP, and LFB staining at 14 days. Scale bars: 1 mm. (B, C) Analyses of GFAP – area and LFB‐positive ratio in both groups. n = 4. *P < 0.05 versus the wild type. (D) Representative images from GFAP immunostaining at the lesion site on 14 dpo. Scale bars: 100 μm. (E) Quantitative analyses of the number of astrocytes and GFAP fluorescence mean intensity (corrected by cell number). n = 4. *P < 0.05 versus the wild type. (F) Representative images containing glial scar from DAB staining of GFAP at 14 dpo. Scale bars: 200 μm. (G) Quantitative analyses of thickness and volume of glial scar. n = 4. *P < 0.05 versus the wild type. (H) The Basso mouse scale (BMS) of SCI model mice at 7, 14 dpo. n = 8 for wild type, n = 7 for HDC −/−. *P < 0.05 versus the wild type.
