
Figure 1.
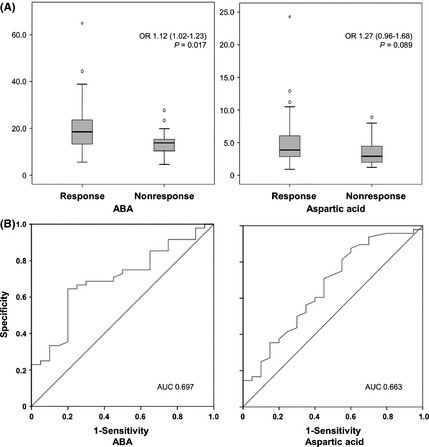
Differences of baseline amino acids between response and nonresponse groups in logistic regression analysis. (A) Alpha‐aminobutyric acid (ABA) and aspartic acid are higher in the response group than in the nonresponse group. P‐values are presented from multivariable analysis including clinical variables. (B) The receiver operating characteristic (ROC) curve analysis demonstrates the discrimination of the ABA and aspartic acid between response and nonresponse groups at baseline.