
Figure 2.
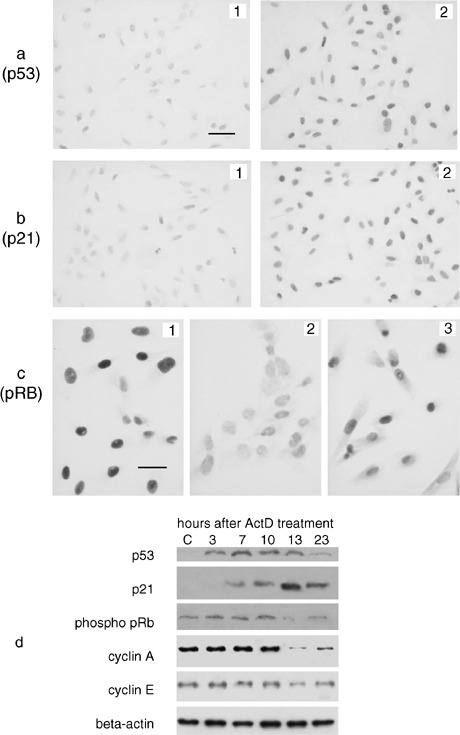
Effect of ActD treatment on the expression of cell cycle related proteins in U2OS cells. (a) Immunocytochemical visualization of p53. In control cells (a1) the nuclei appear to be very weakly stained (bar = 25 µm). Four hour after ActD treatment all U2OS cell nuclei appear to be positive for p53 immunostaining (a2). (b) Immunocytochemical visualization of p21. No or very lightly stained nuclei are detectable in control cells (b1). Many cell nuclei appear to be stained 7 h after the end of ActD treatment (b2). Same magnification as in Fig. 2a. (c) Phosphorylated pRB immunostaining. In control cells (c1) intensely stained nuclei are present (Bar = 12.5 µm). In ActD‐treated cells (c2), at 13 h after the end of drug treatment, all the nuclei appear to be very faintly stained. At 23 h after the end of ActD treatment (c3), the staining intensity of cell nuclei appears to be higher than in Fig. 2c. (d) Western blot analysis of cell cycle related proteins in U2OS control (C) and ActD‐treated cells, evaluated 3, 7, 10, 13 and 23 h after the end of drug treatment. Note the early increase of p53 level, followed by the increase of p21 with the contemporary reduction of the expression of the hyper‐phosphorylated form of pRB, cyclin A and cyclin E, at 13 h after the end of ActD treatment. The level of these changes appears to be reduced at 23 h after the end of drug treatment.