
Figure 1.
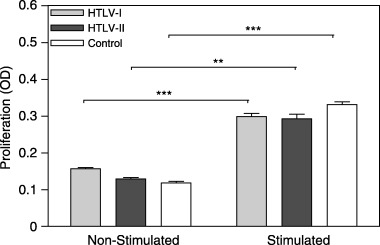
Evaluation of non‐stimulated and mitogen‐stimulated T‐cell proliferation (HTLV‐I: n = 18; HTLV‐II: n = 10; control: n = 11). PBMCs were cultured with and without 1% PHA for 96 h and cell proliferation/viability was estimated by MTT assay. OD was determined at wavelengths of 492 and 630 nm. Statistical significance differences are indicated: **P < 0.01; ***P < 0.001.