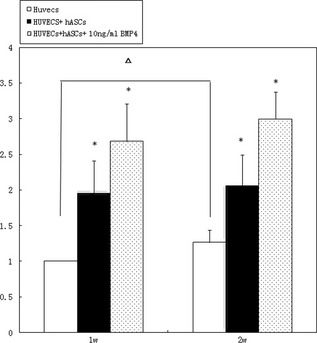
Figure 9.

At 1 week (1 w), there were significant differences between conditions in experimental groups and the control group, with group B significantly higher than group A ( P < 0.05). At 2 weeks (2 w), there were also significant differences between the experimental groups and control group, with group B being significantly higher than group A (P < 0.05). Asterisk stands for P < 0.05 comparing experimental groups with the control group at one time point; delta stands for P < 0.05 comparing the same group between different time points.
