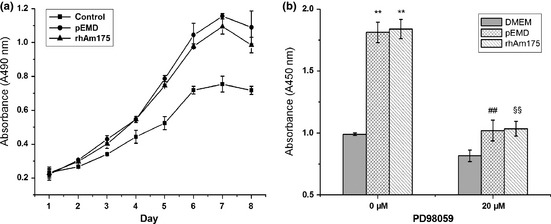
Figure 4.

Mitogenic responses of human PDLF s to 10 μg/ml rHhAm175 or 200 μg/ml p EMD . (a) rHhAm175‐treated group had higher levels of proliferation compared to controls from day 3 (P < 0.01), and this upward trend was maintained until day 8. There were no significant differences between rHhAm175‐ and pEMD‐treated cells at each time point. (b) Increased DNA synthesis of human PDLFs in response to pEMD or rHhAm175 and their inhibition by 20 μm PD98059. **P < 0.01, pEMD versus DMEM; rHhAm175 versus DMEM. ##P < 0.01, pEMD versus pEMD+PD98059. §§P < 0.01, rHhAm175 versus rHhAm175 + PD98059. Bars represent standard deviation (SD).
