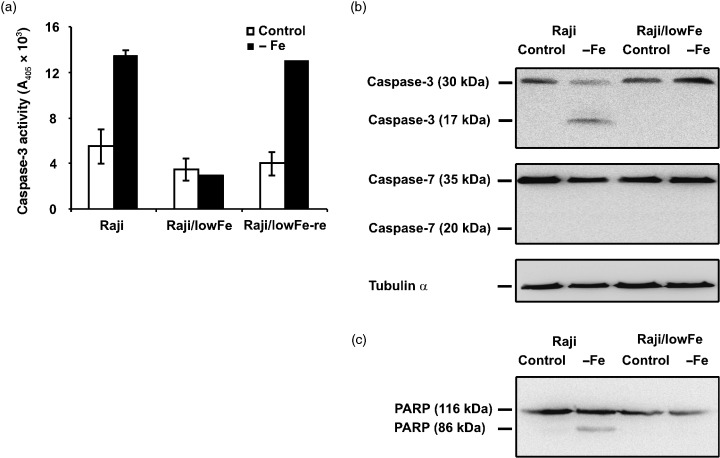
Figure 3.

Effect of iron deprivation on caspase‐3/caspase‐7 activity in sensitive Raji cells, resistant Raji/lowFe cells and sensitive Raji/lowFe‐re cells. Cells were incubated in iron‐free medium (– Fe) for 48 h. Raji and Raji/lowFe‐re cells of the control were incubated in transferrin (5 µg/ml) medium and Raji/lowFe cells of the control in low‐iron (50 µm ferric citrate) medium. (a) The activity of caspase‐3 was measured as the absorbance of the cleaved product of a caspase‐3 chromogenic substrate at 405 nm employing the commercial colourimetric assay kit (see Materials and methods). Each column represents the mean of two experimental values ± SEM. The data shown were obtained in one representative experiment of three independent experiments. (b) The activation of caspase‐3 and caspase‐7 were assessed by Western blot analysis, employing specific rabbit polyclonal antibody against human caspase‐3 and specific mouse monoclonal antibody against human caspase‐7 (see Materials and methods). Locations of the 17‐kDa fragment of active caspase‐3 and of the 30‐kDa inactive precursor of caspase‐3 are shown. Similarly, locations of the 20‐kDa fragment of active caspase‐7 and of the 35‐kDa inactive precursor of caspase‐7 are shown. Specific mouse monoclonal antibody against α‐tubulin (see Materials and methods) was used to confirm equal protein loading. The data shown were obtained in one representative experiment of three independent experiments. (c) The activity of caspase‐3 was also assessed by Western blot analysis employing specific mouse monoclonal antibody against specific caspase‐3/caspase‐7 substrate PARP (see Materials and methods). Locations of the 86‐kDa cleaved fragment of PARP and of the 116‐kDa intact PARP are shown. The data shown were obtained in one representative experiment of two independent experiments.
