
Figure 2.
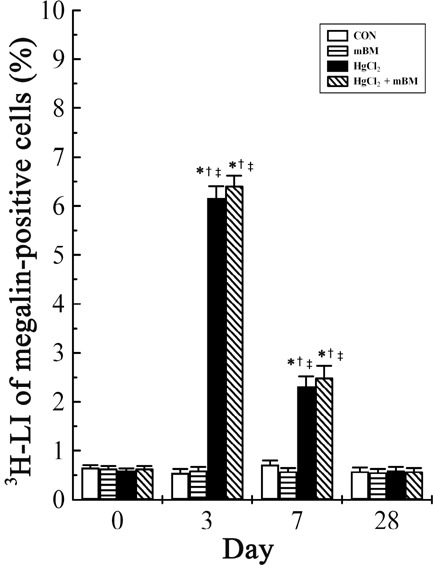
Changes in the total 3H‐LI of megalin‐positive epithelial cells in the kidney of mice treated with HgCl2 with or without bone marrow cells (BMCs). n = 5 mice per treatment time for each group. *P < 0.05 versus the same group at day 0; †P < 0.05 vs. group CON at the corresponding time point; ‡P < 0.05 versus group mBM at the corresponding time point. CON, control; mBM, male bone marrow.