
Figure 3.
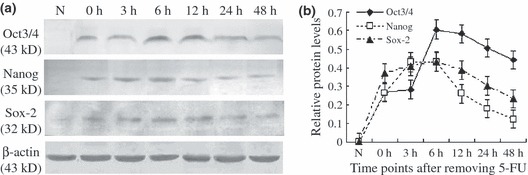
Expression levels of Oct3/4, Nanog and Sox2 proteins in rat tracheal epithelium during recovery from 5‐FU induced injury. (a) Western blot analysis of Oct3/4, Nanog and Sox2 proteins in normal trachea and 5‐FU‐treated tracheas. (b) Expression levels of Oct3/4, Nanog and Sox2 relative to β‐actin. Data are presented as mean ± SD of three independent experiments.